Total traffic is not audience traffic.
Server logs include humans, bots, broken assets, redirects, attacks, monitoring tools, API calls, crawlers, and failed requests. Server Glance separates the mess into useful business language.
 Server Glance
Mac web server log analyzer for serious websites
Server Glance turns Apache, Nginx, IIS, CloudFront, Cloudflare, AWS, and other web server logs into fast reports for executives, marketers, ecommerce teams, SEO, and security reviews — without sending private traffic data to the cloud.
Server logs include humans, bots, broken assets, redirects, attacks, monitoring tools, API calls, crawlers, and failed requests. Server Glance separates the mess into useful business language.
Ad blockers, JavaScript failures, privacy settings, bots, and server errors can make browser analytics incomplete. Your server log still records the request.
Export polished PDFs for executive summaries, marketing performance, SEO crawl issues, technical evidence, security findings, and month-over-month comparisons.
Reports built in
Server Glance is designed to summarize massive log files quickly, save monthly summary data, and compare week-over-week, month-over-month, and year-over-year patterns.
Total traffic, human pageviews, bot share, referrals, page types, and traffic mix.
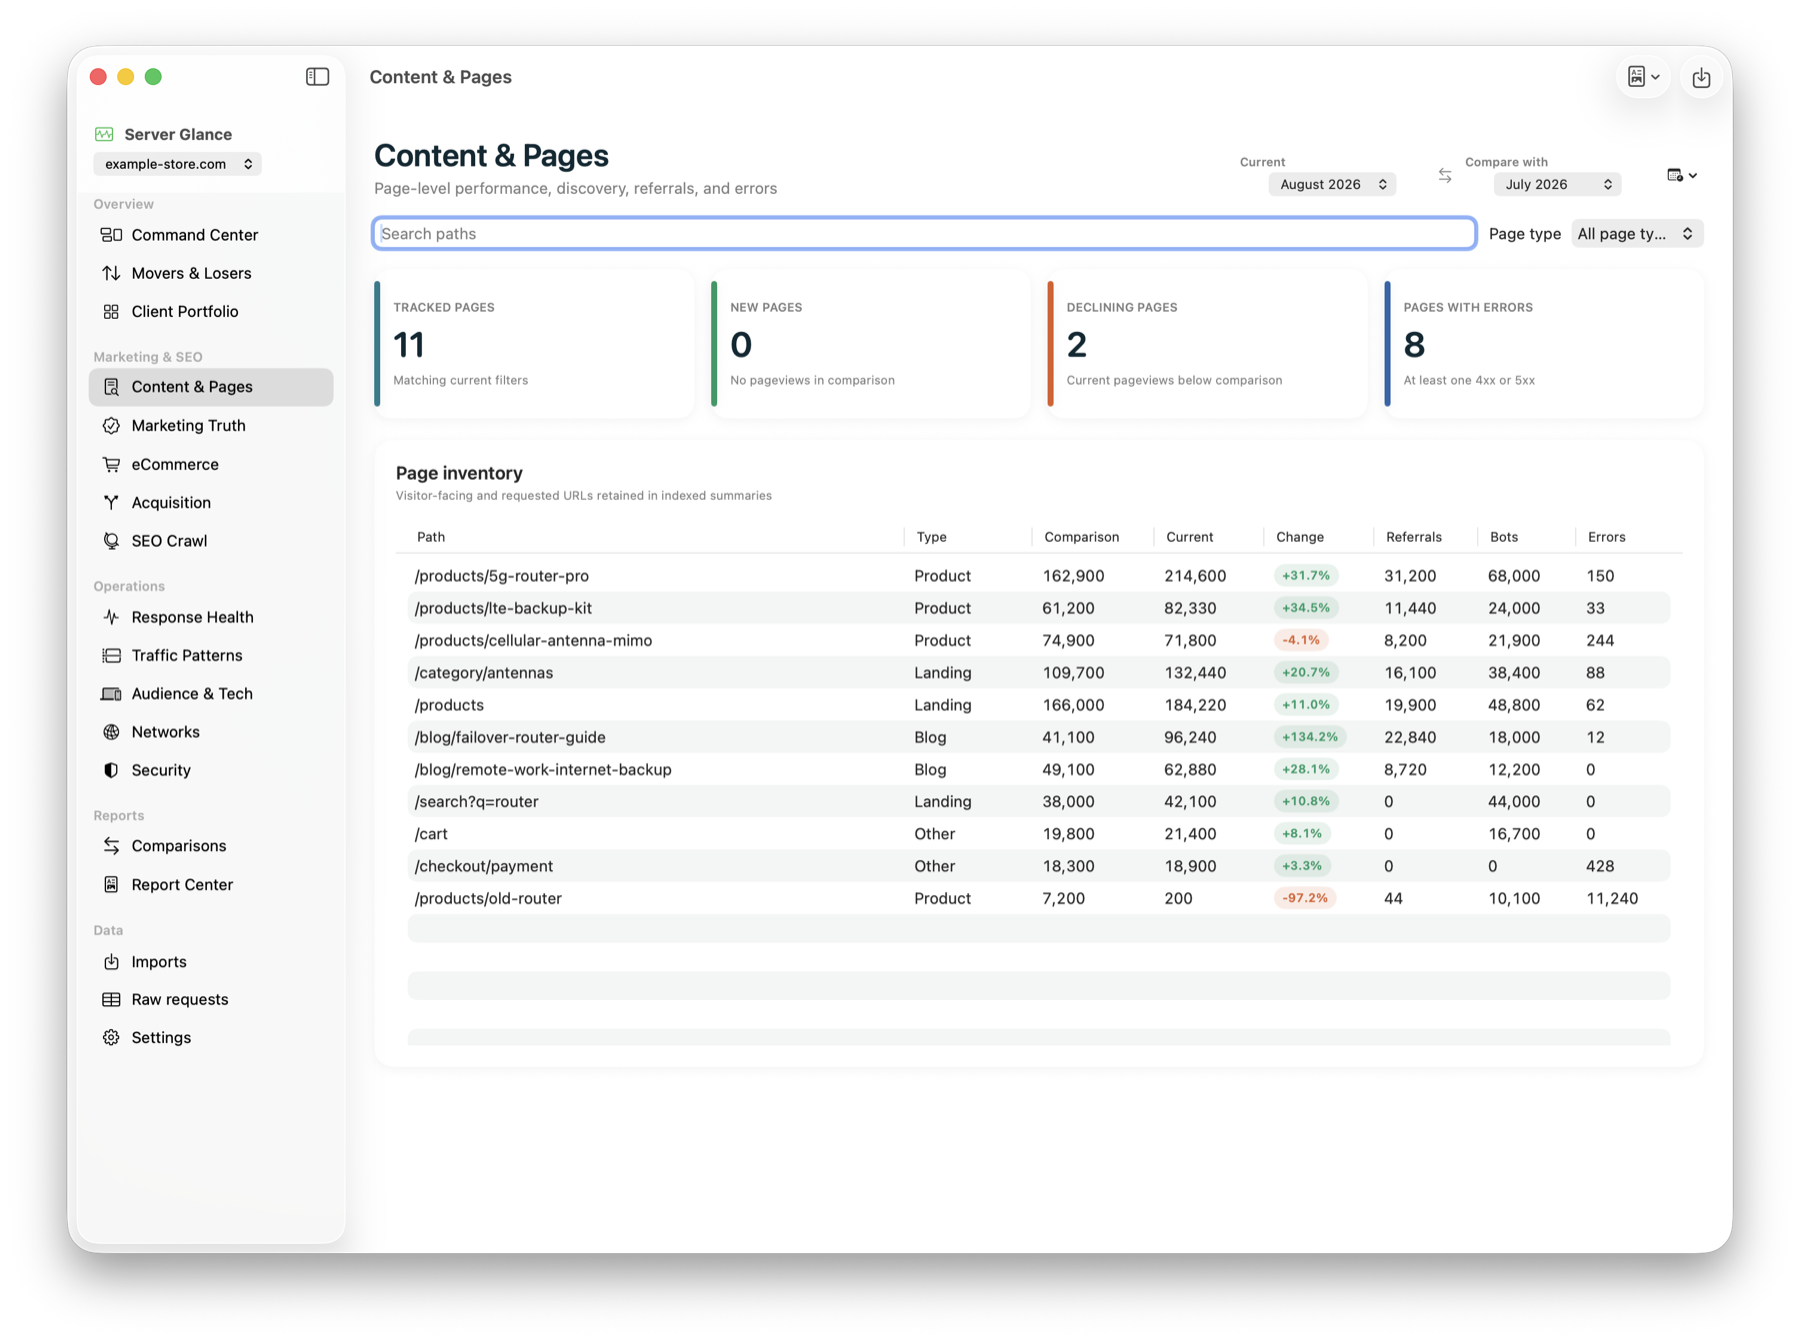
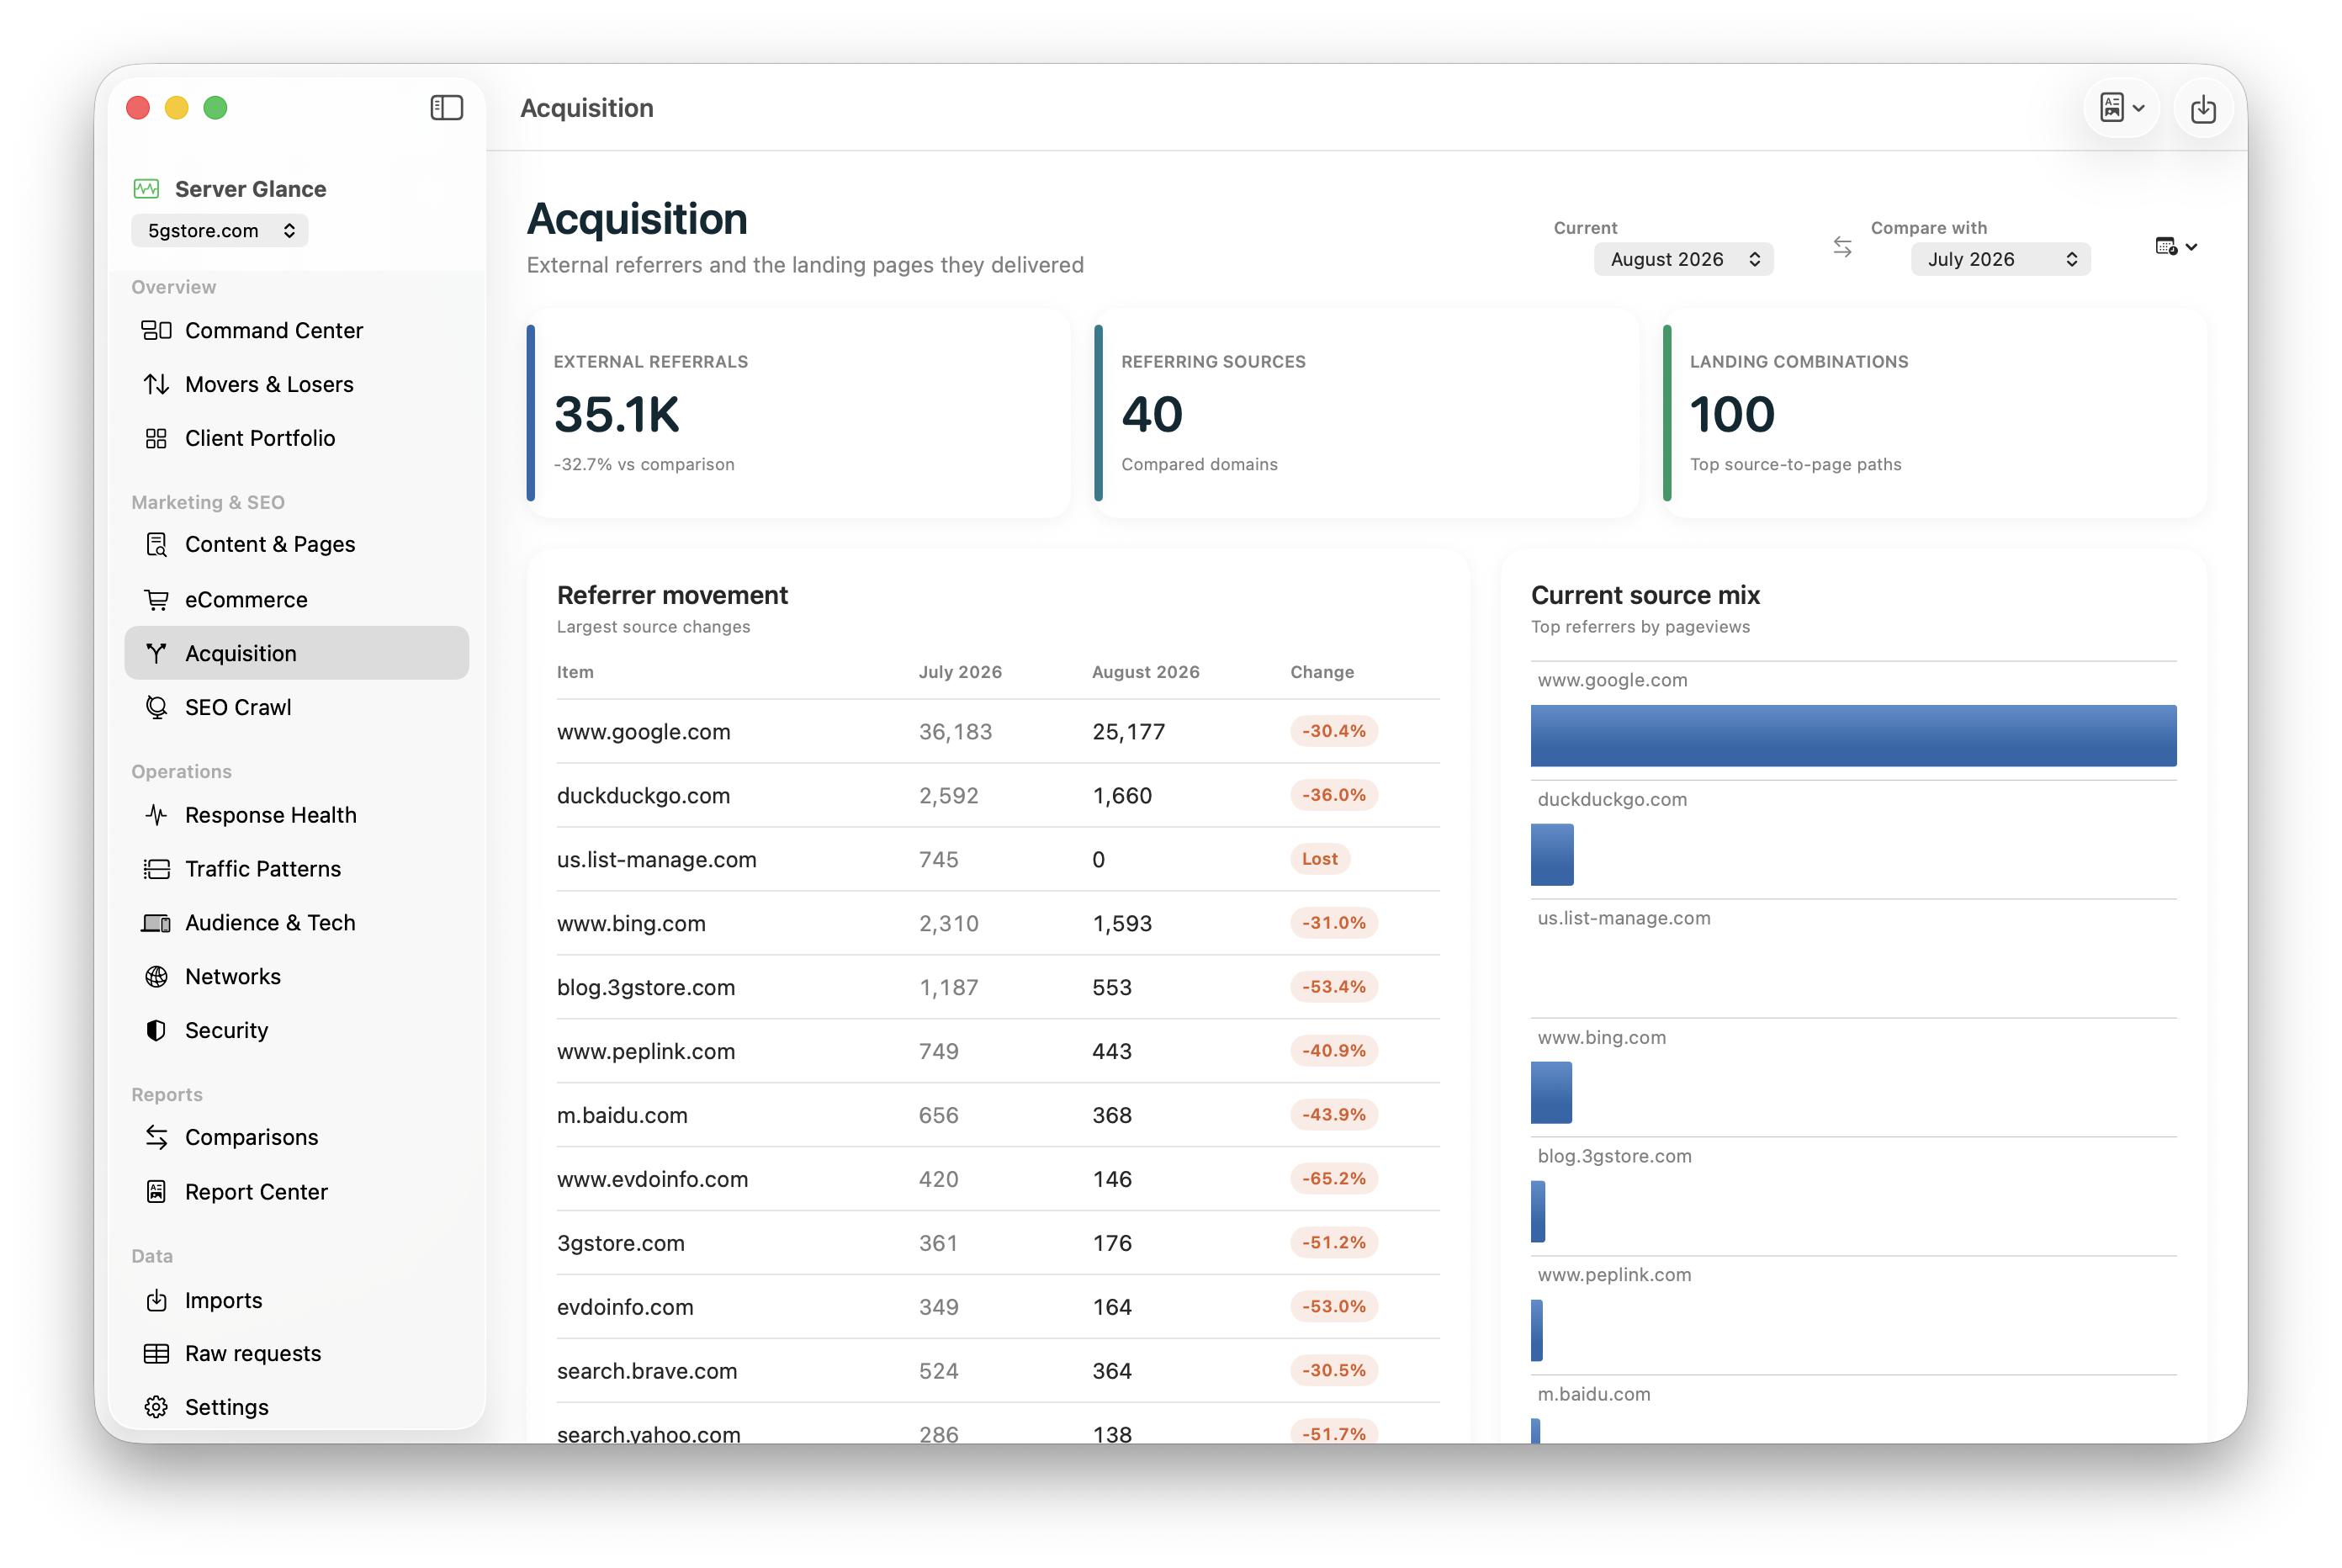
Referral sources, landing pages, campaign evidence, content movers, and page trends.
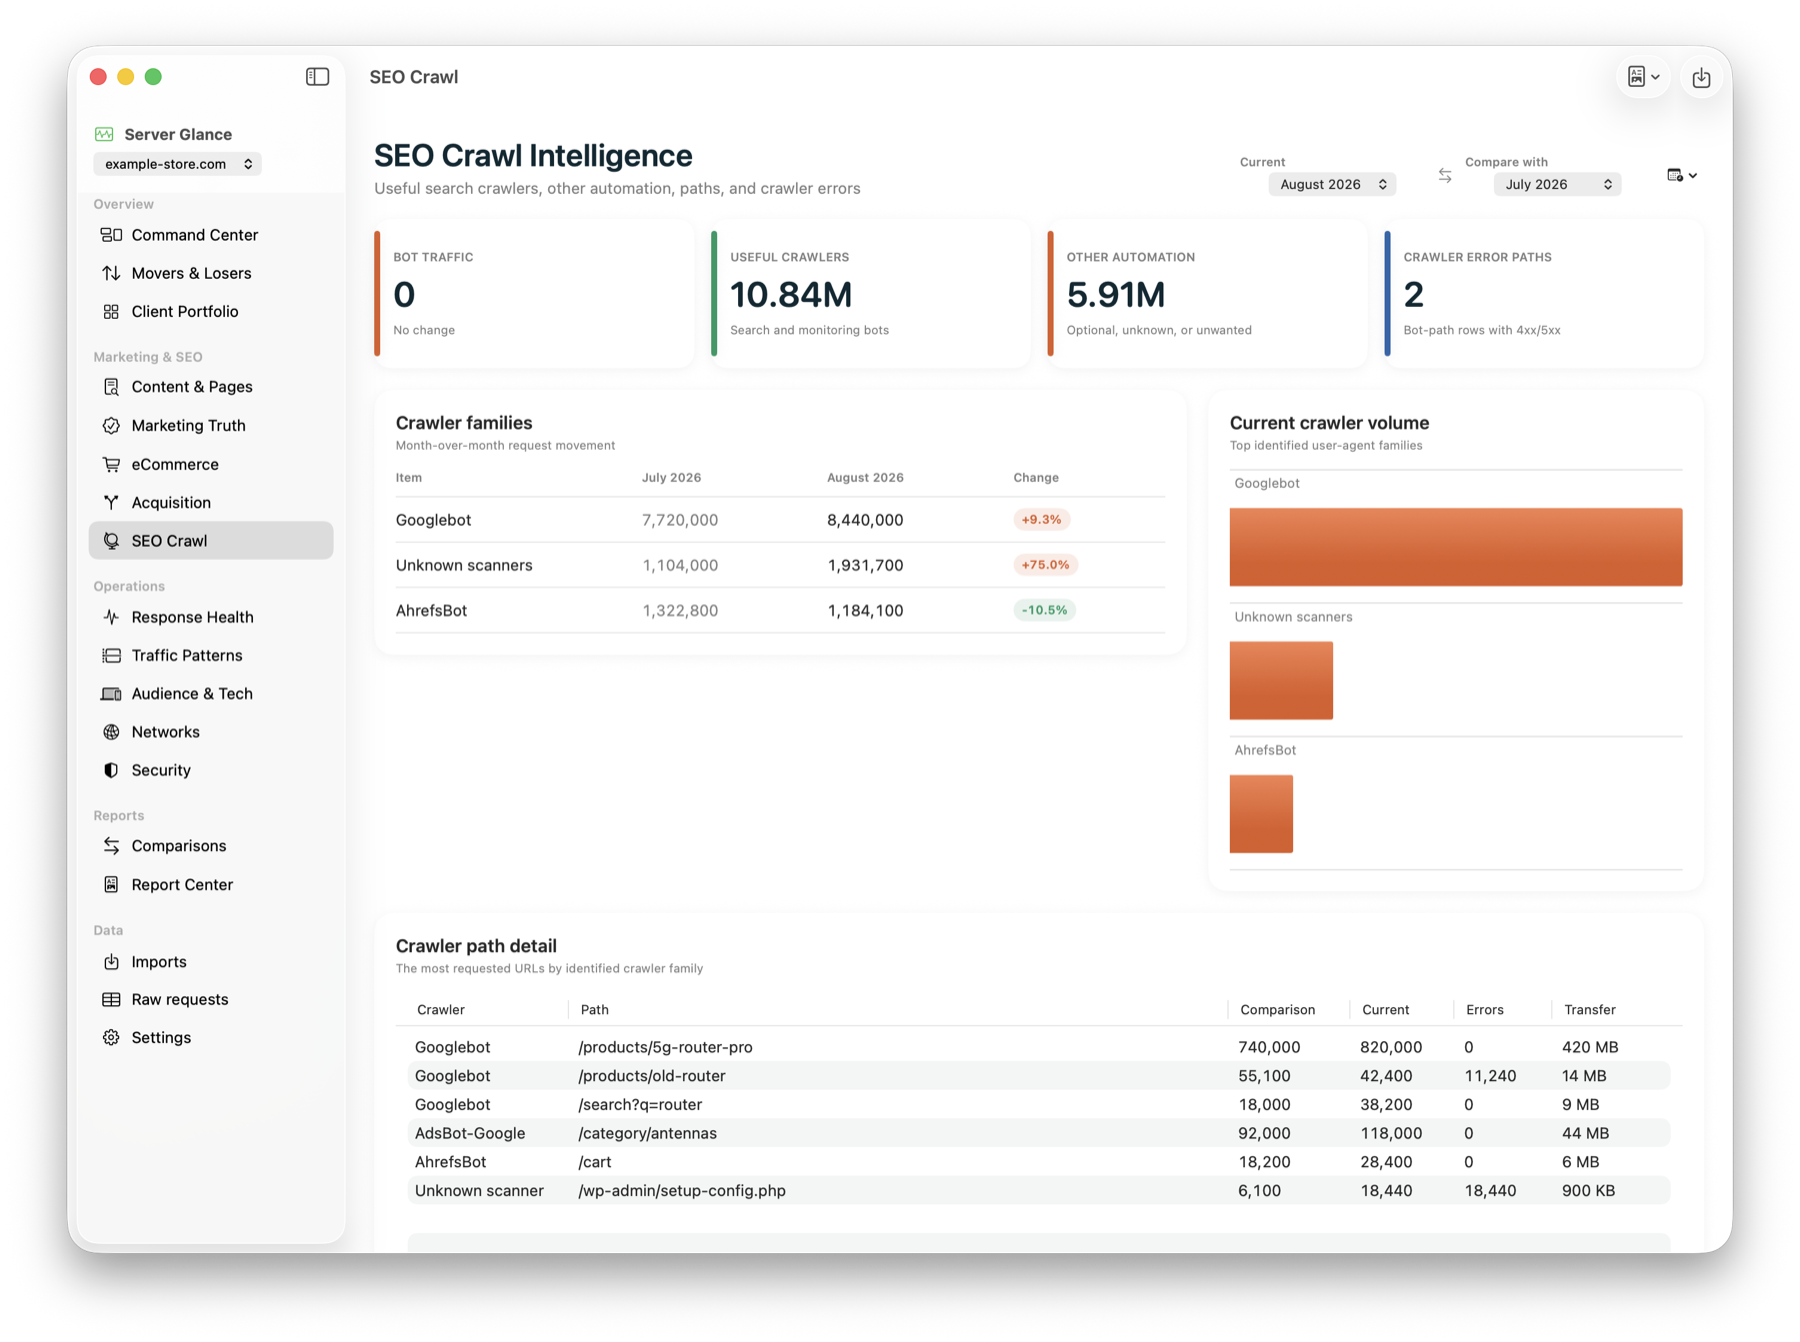
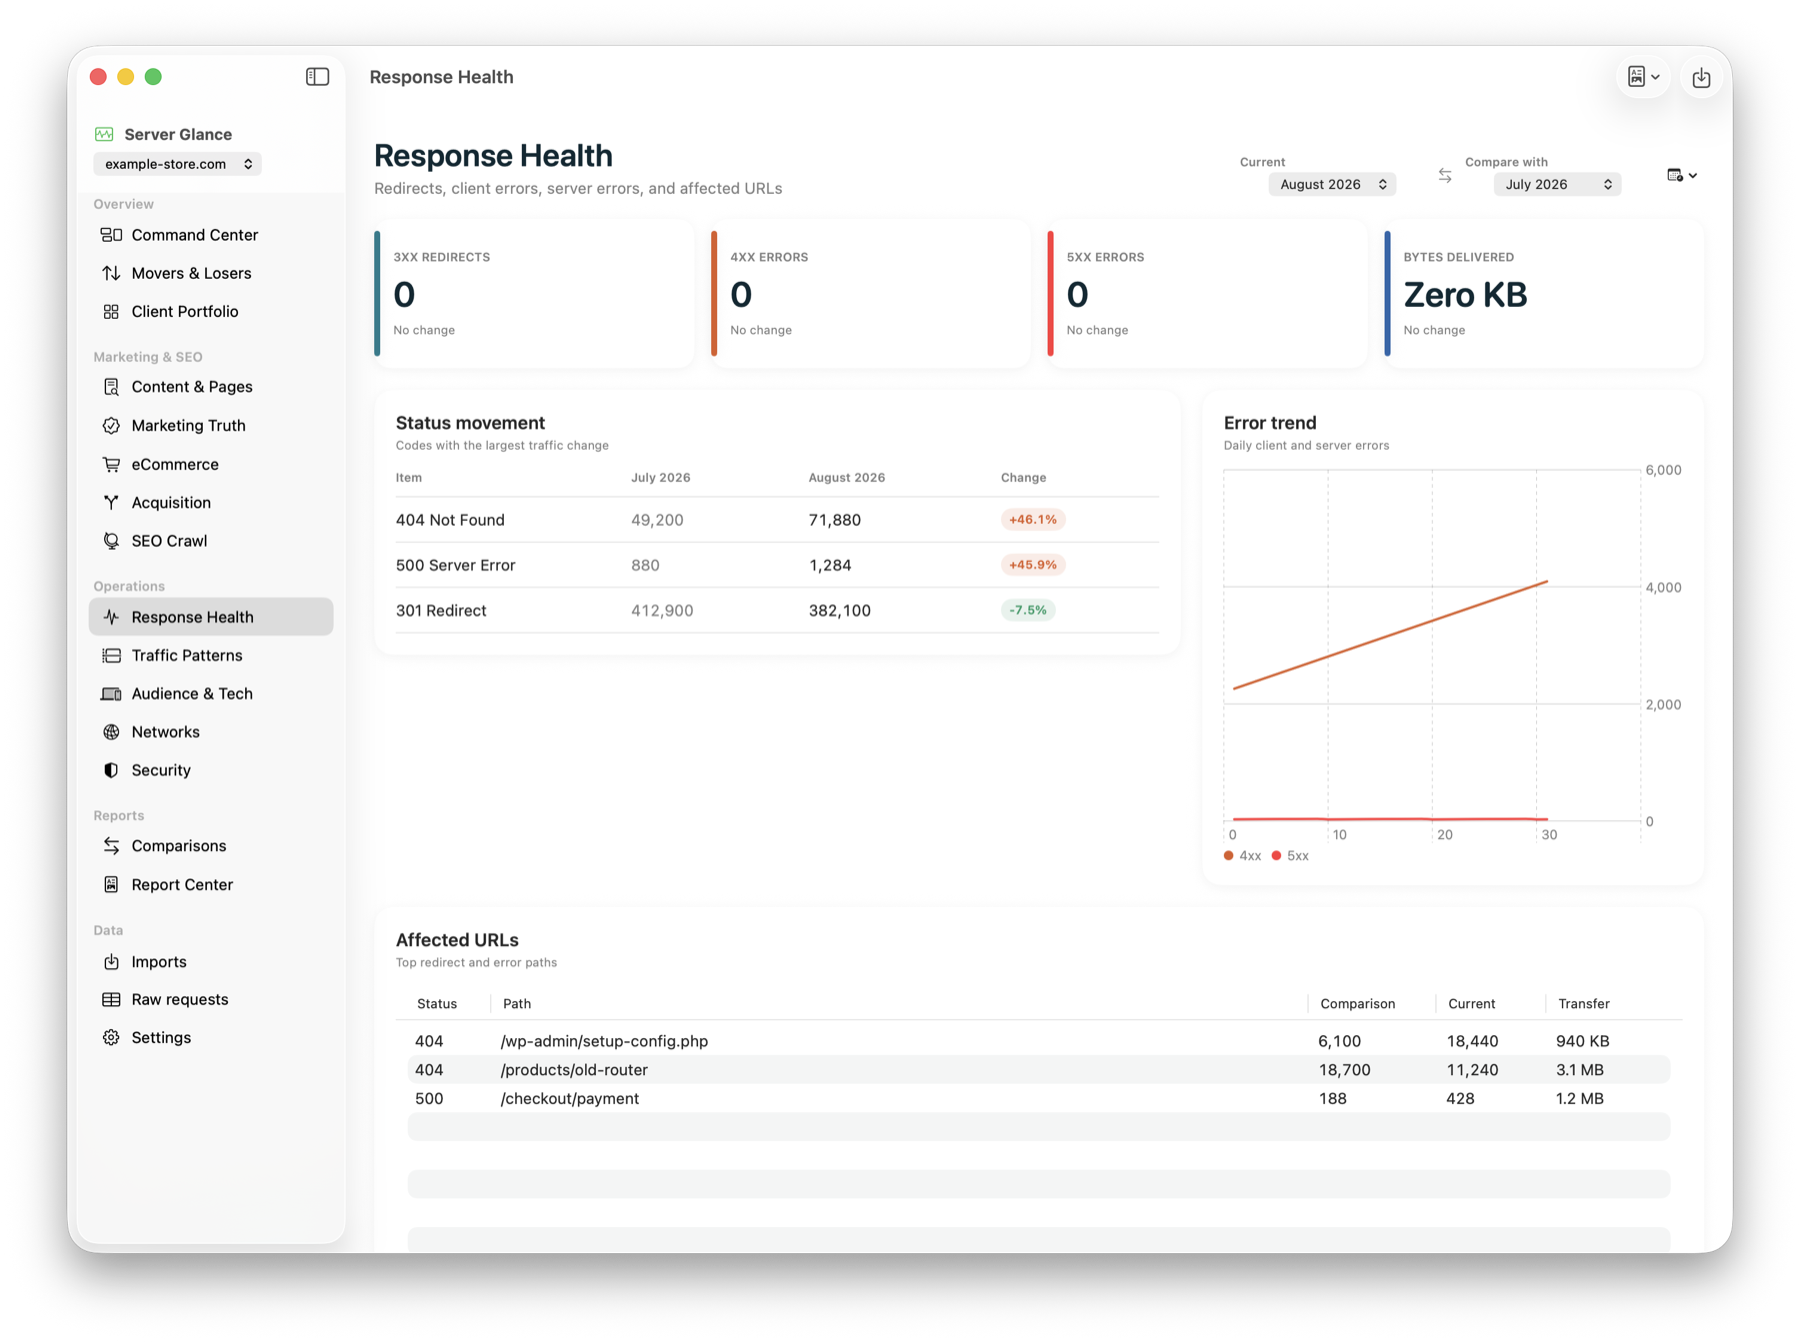
What Google sees, crawl waste, crawler errors, response health, and high-value pages.
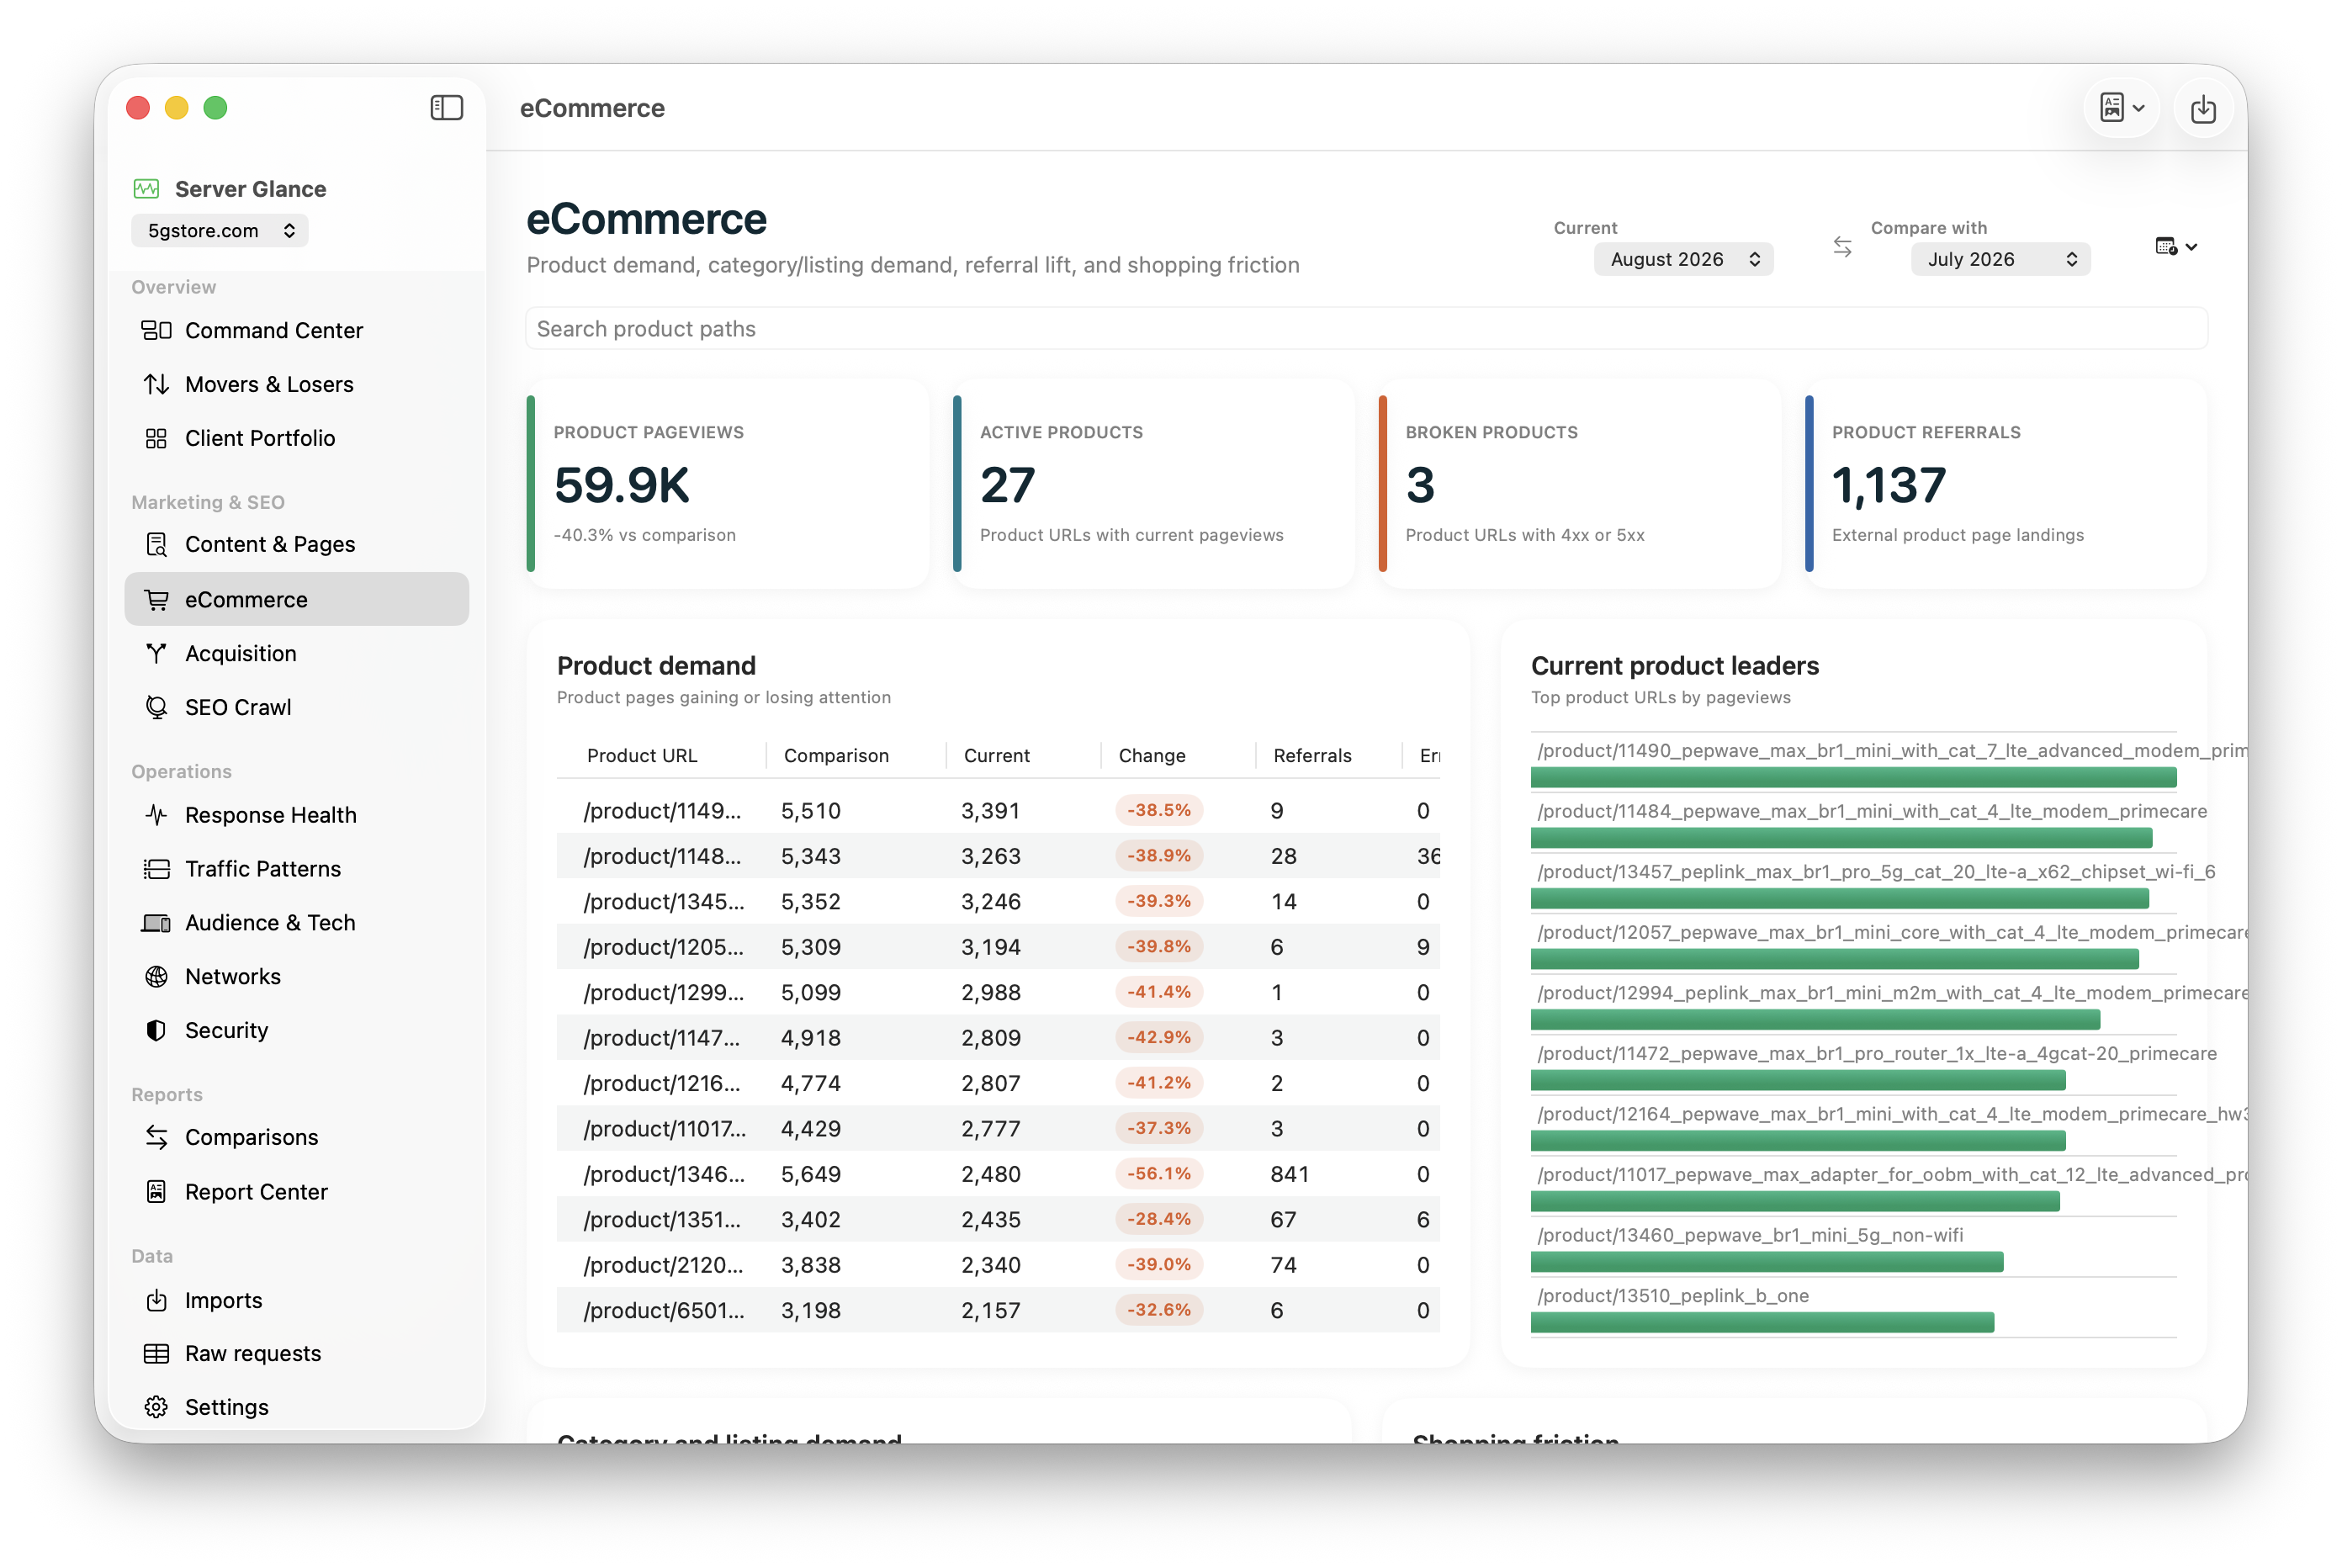
Product traffic, product referrals, shopping behavior signals, and product movement.
SQL probes, credential attacks, sensitive-file requests, bad bots, and success signals.
Raw request drilldowns and defensible evidence for developers, hosts, and security teams.
Product screens
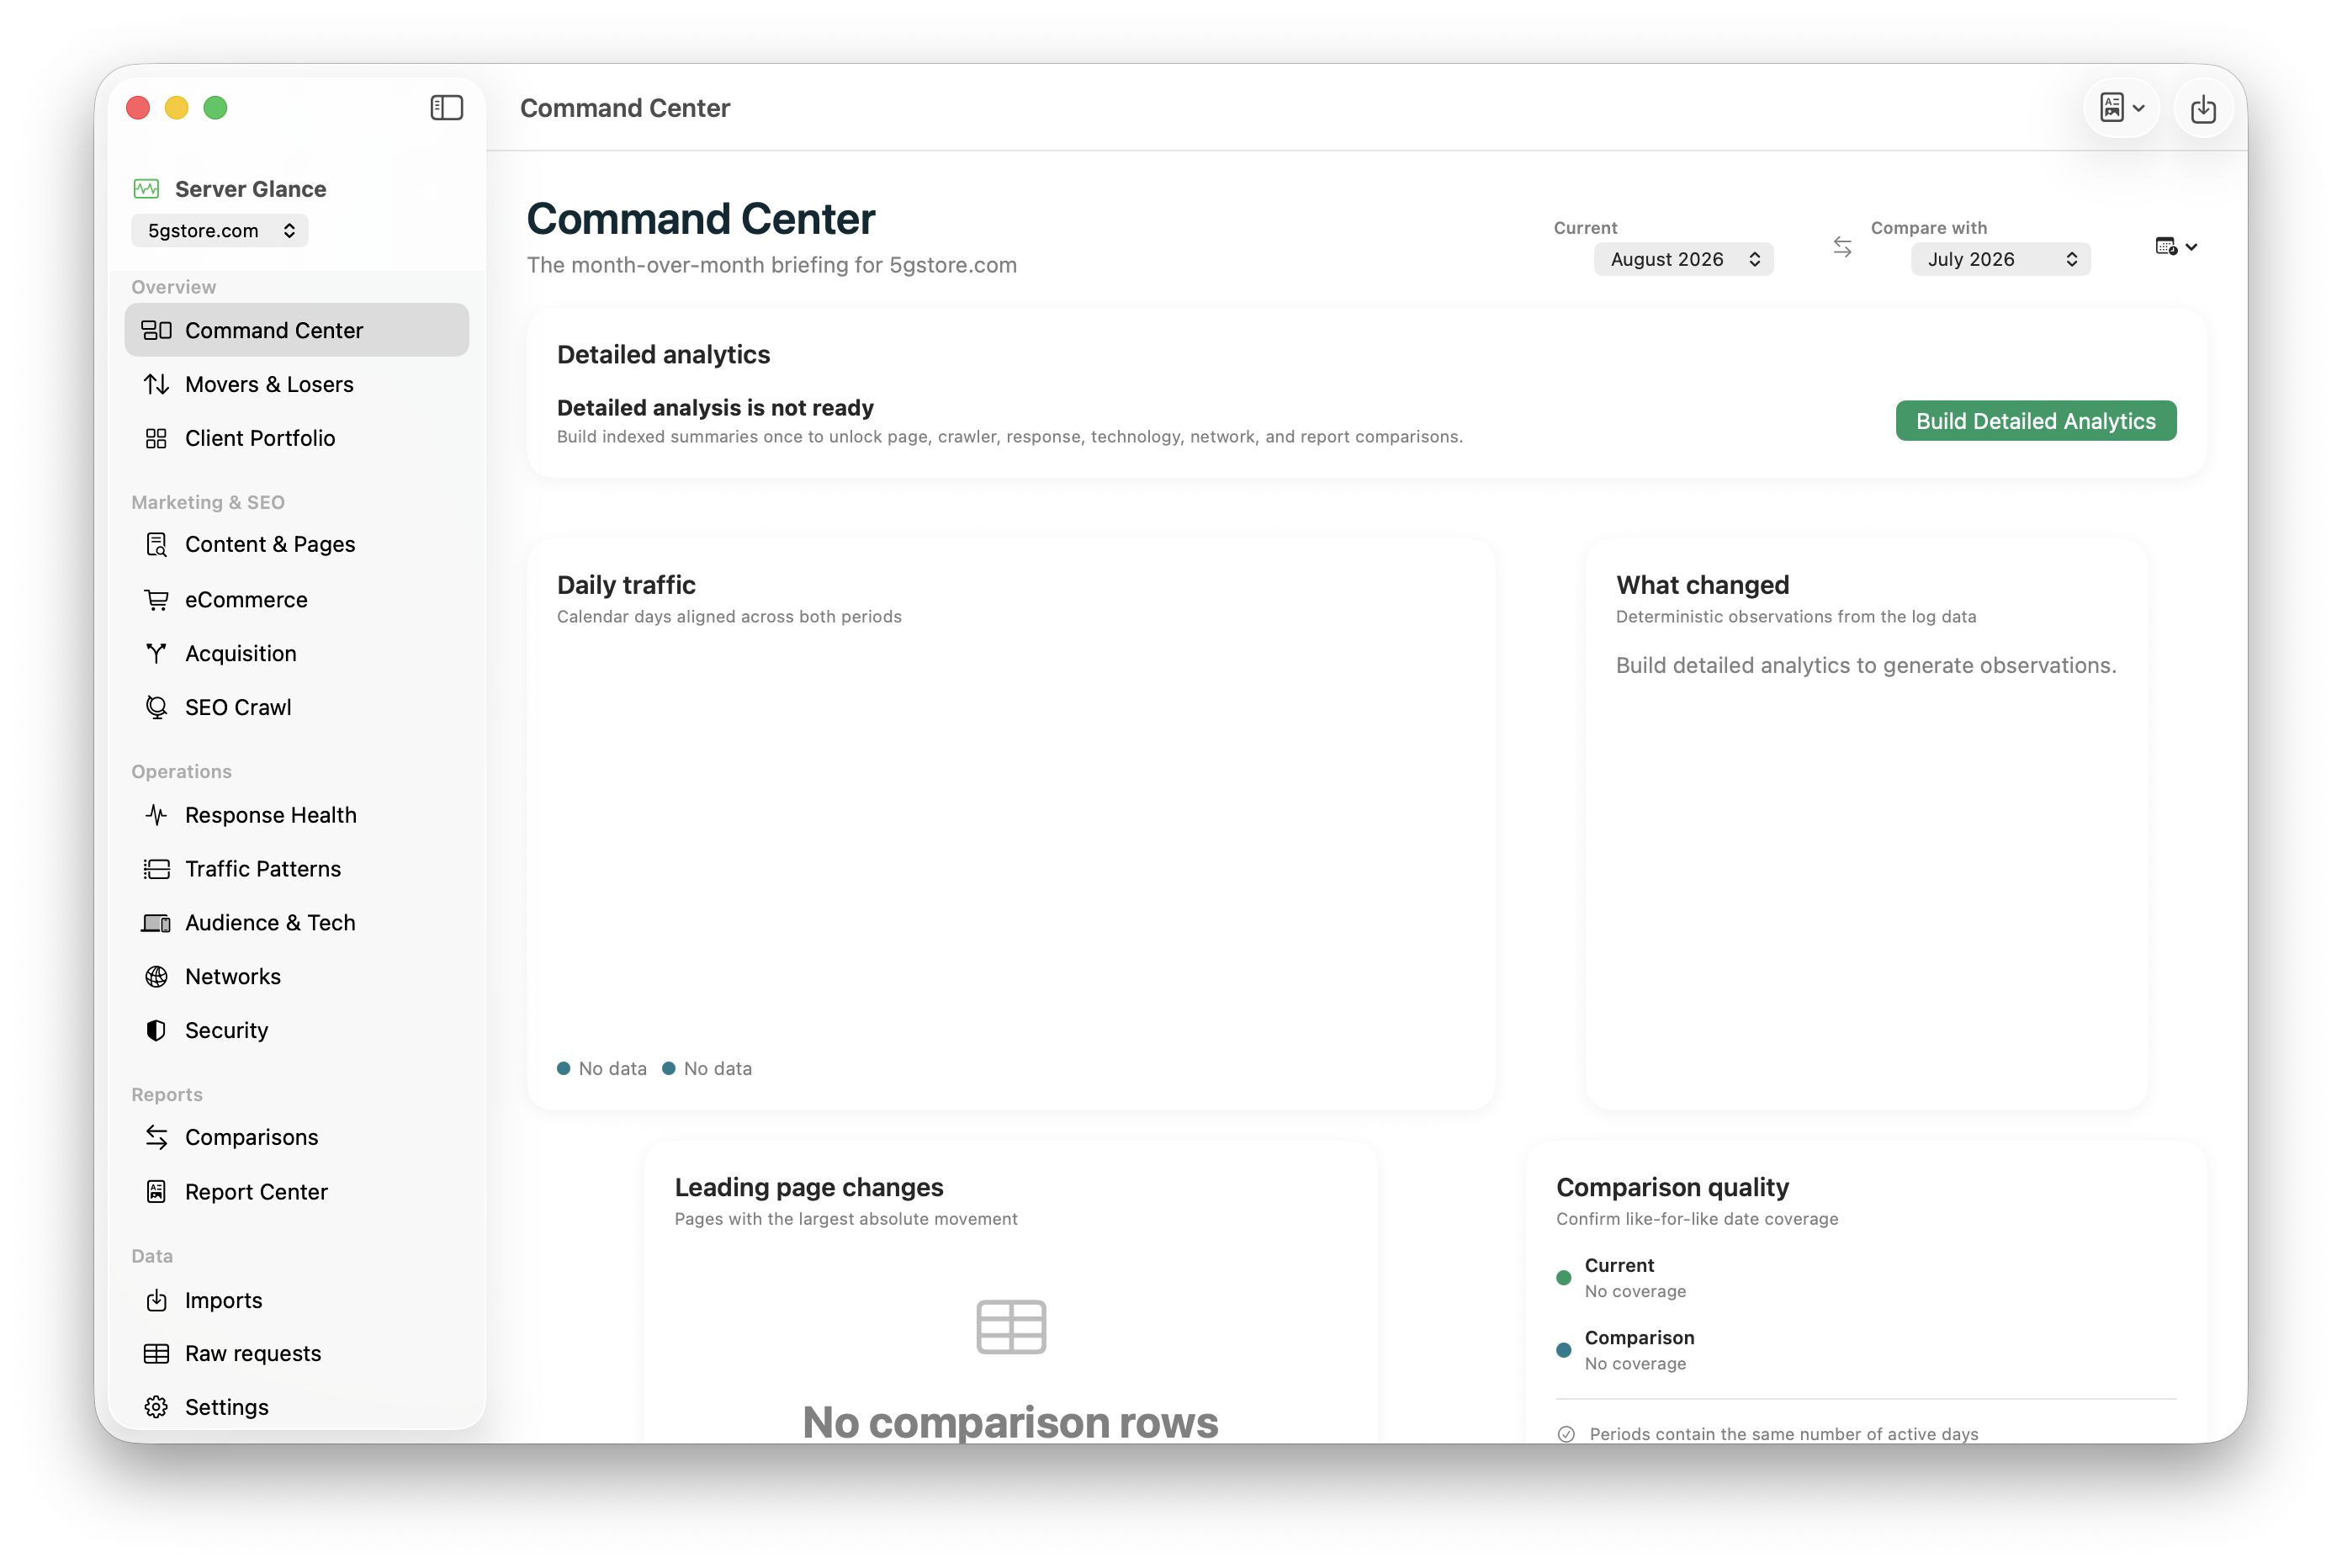
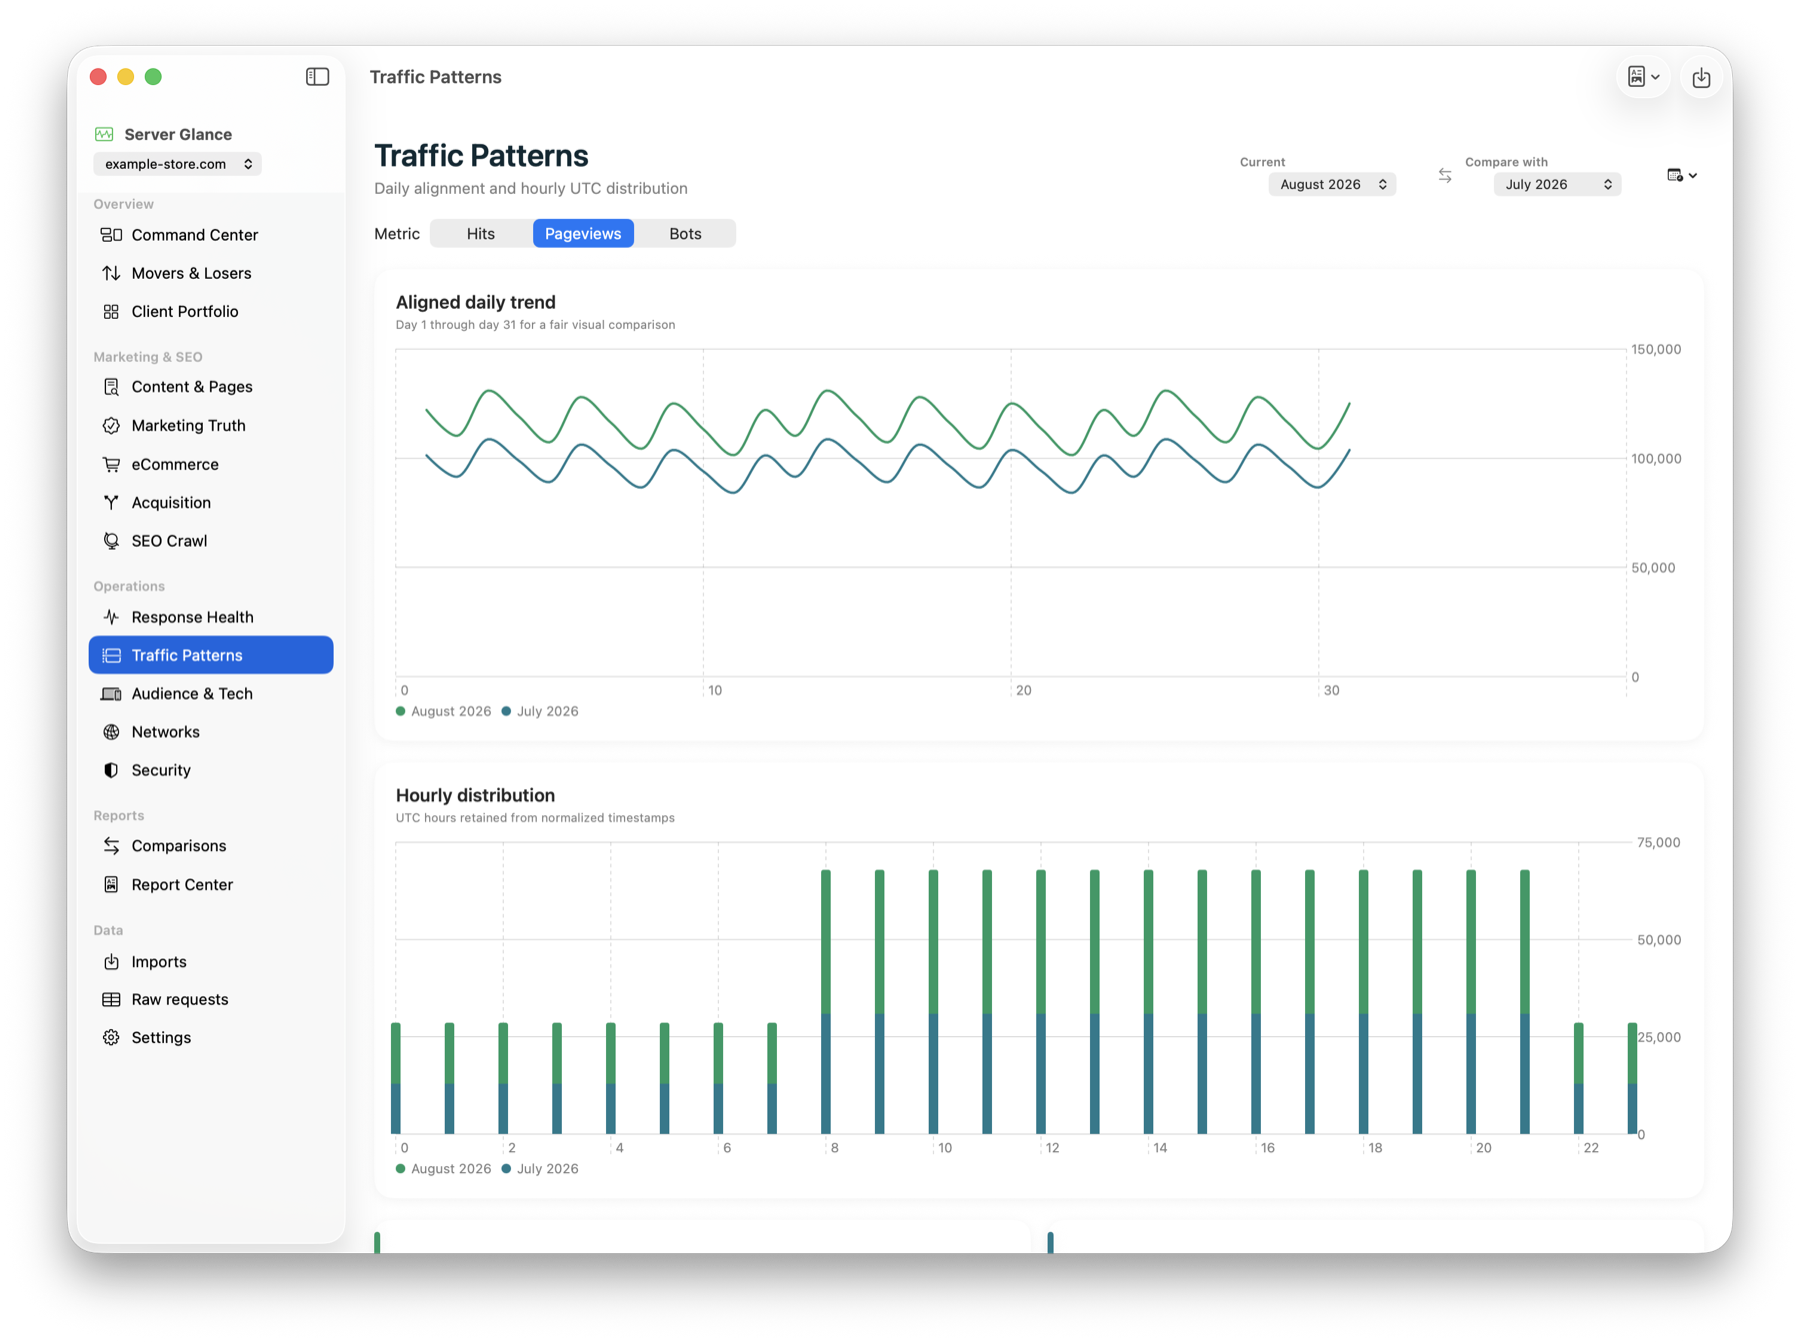
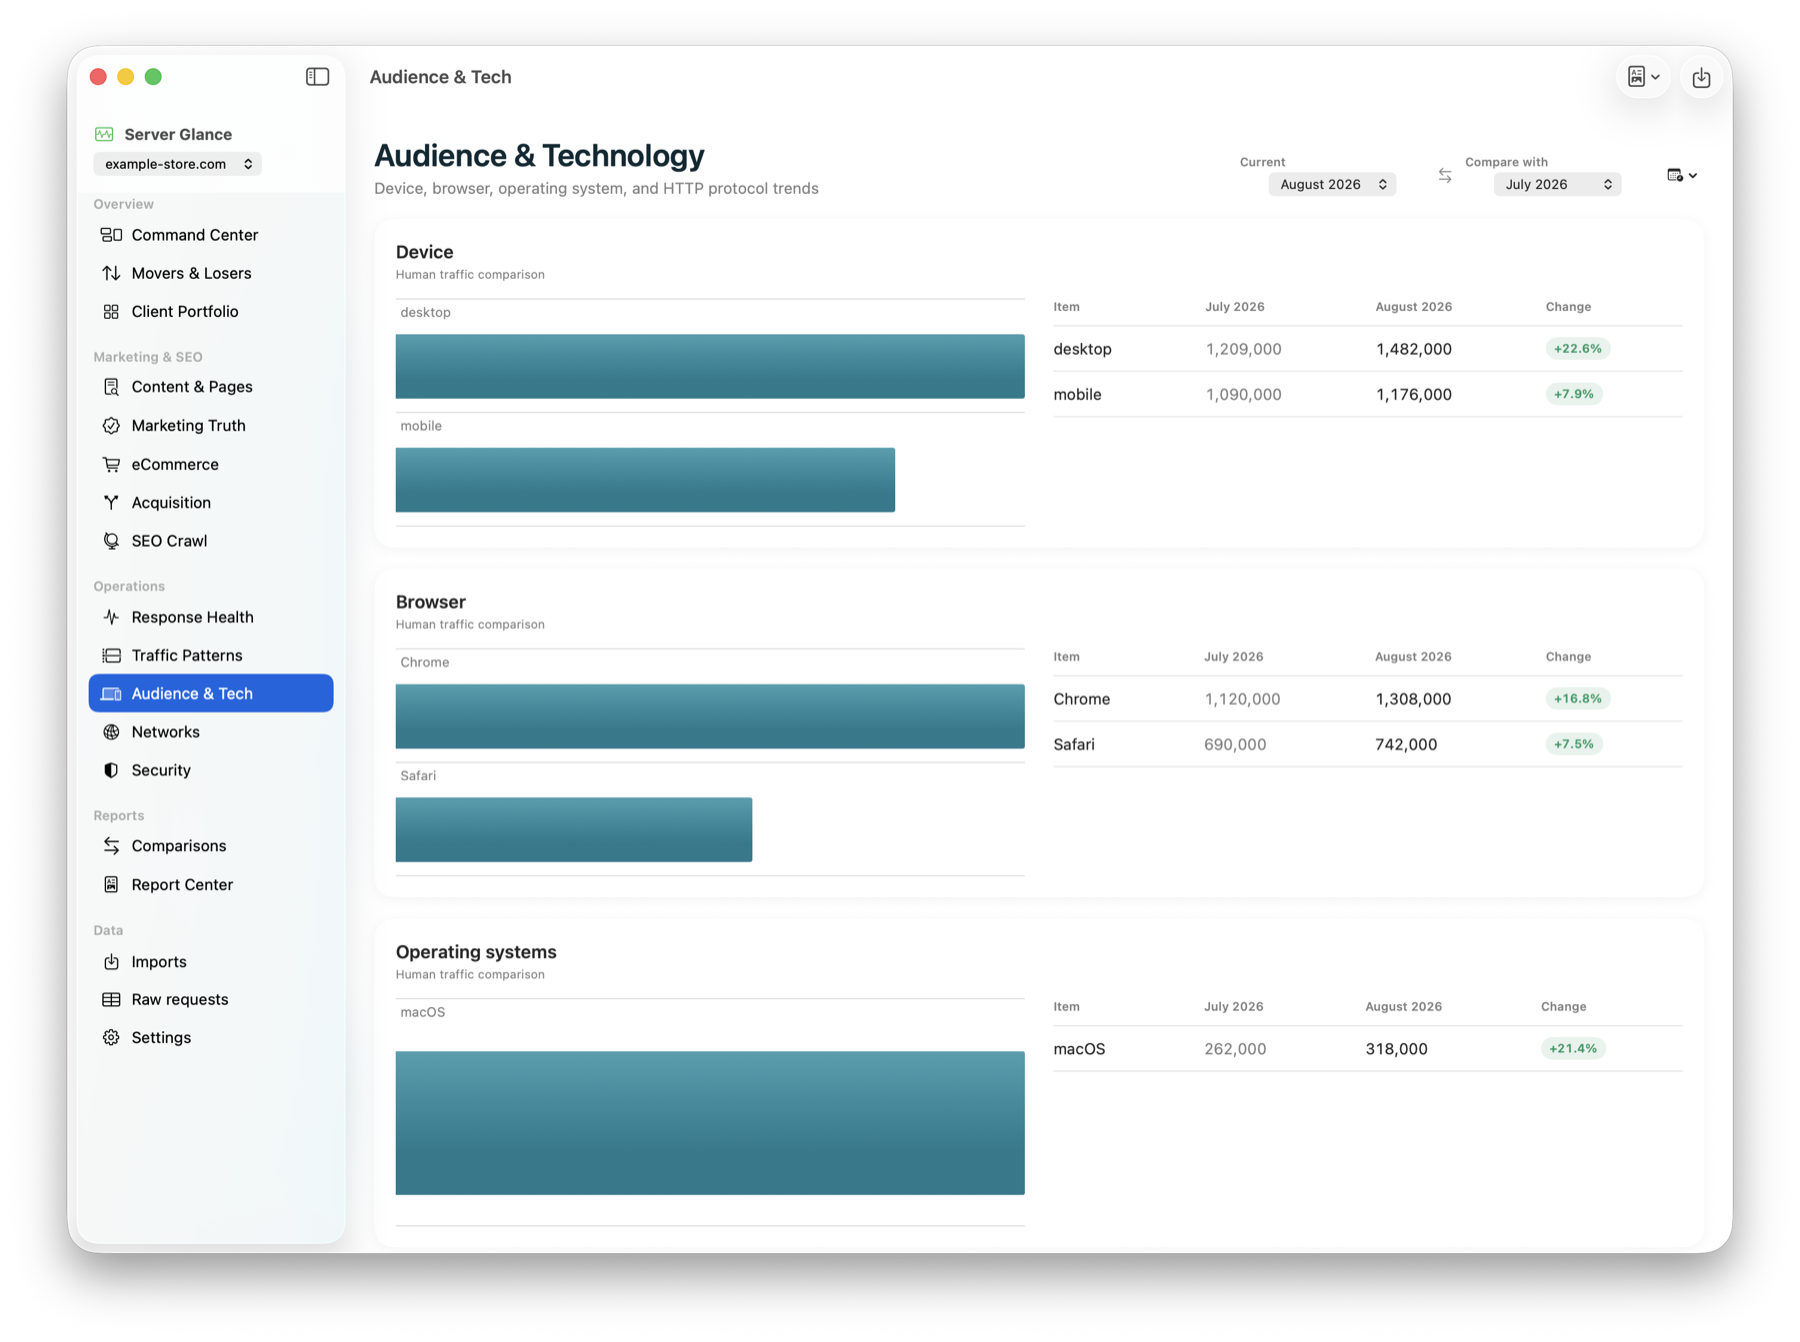
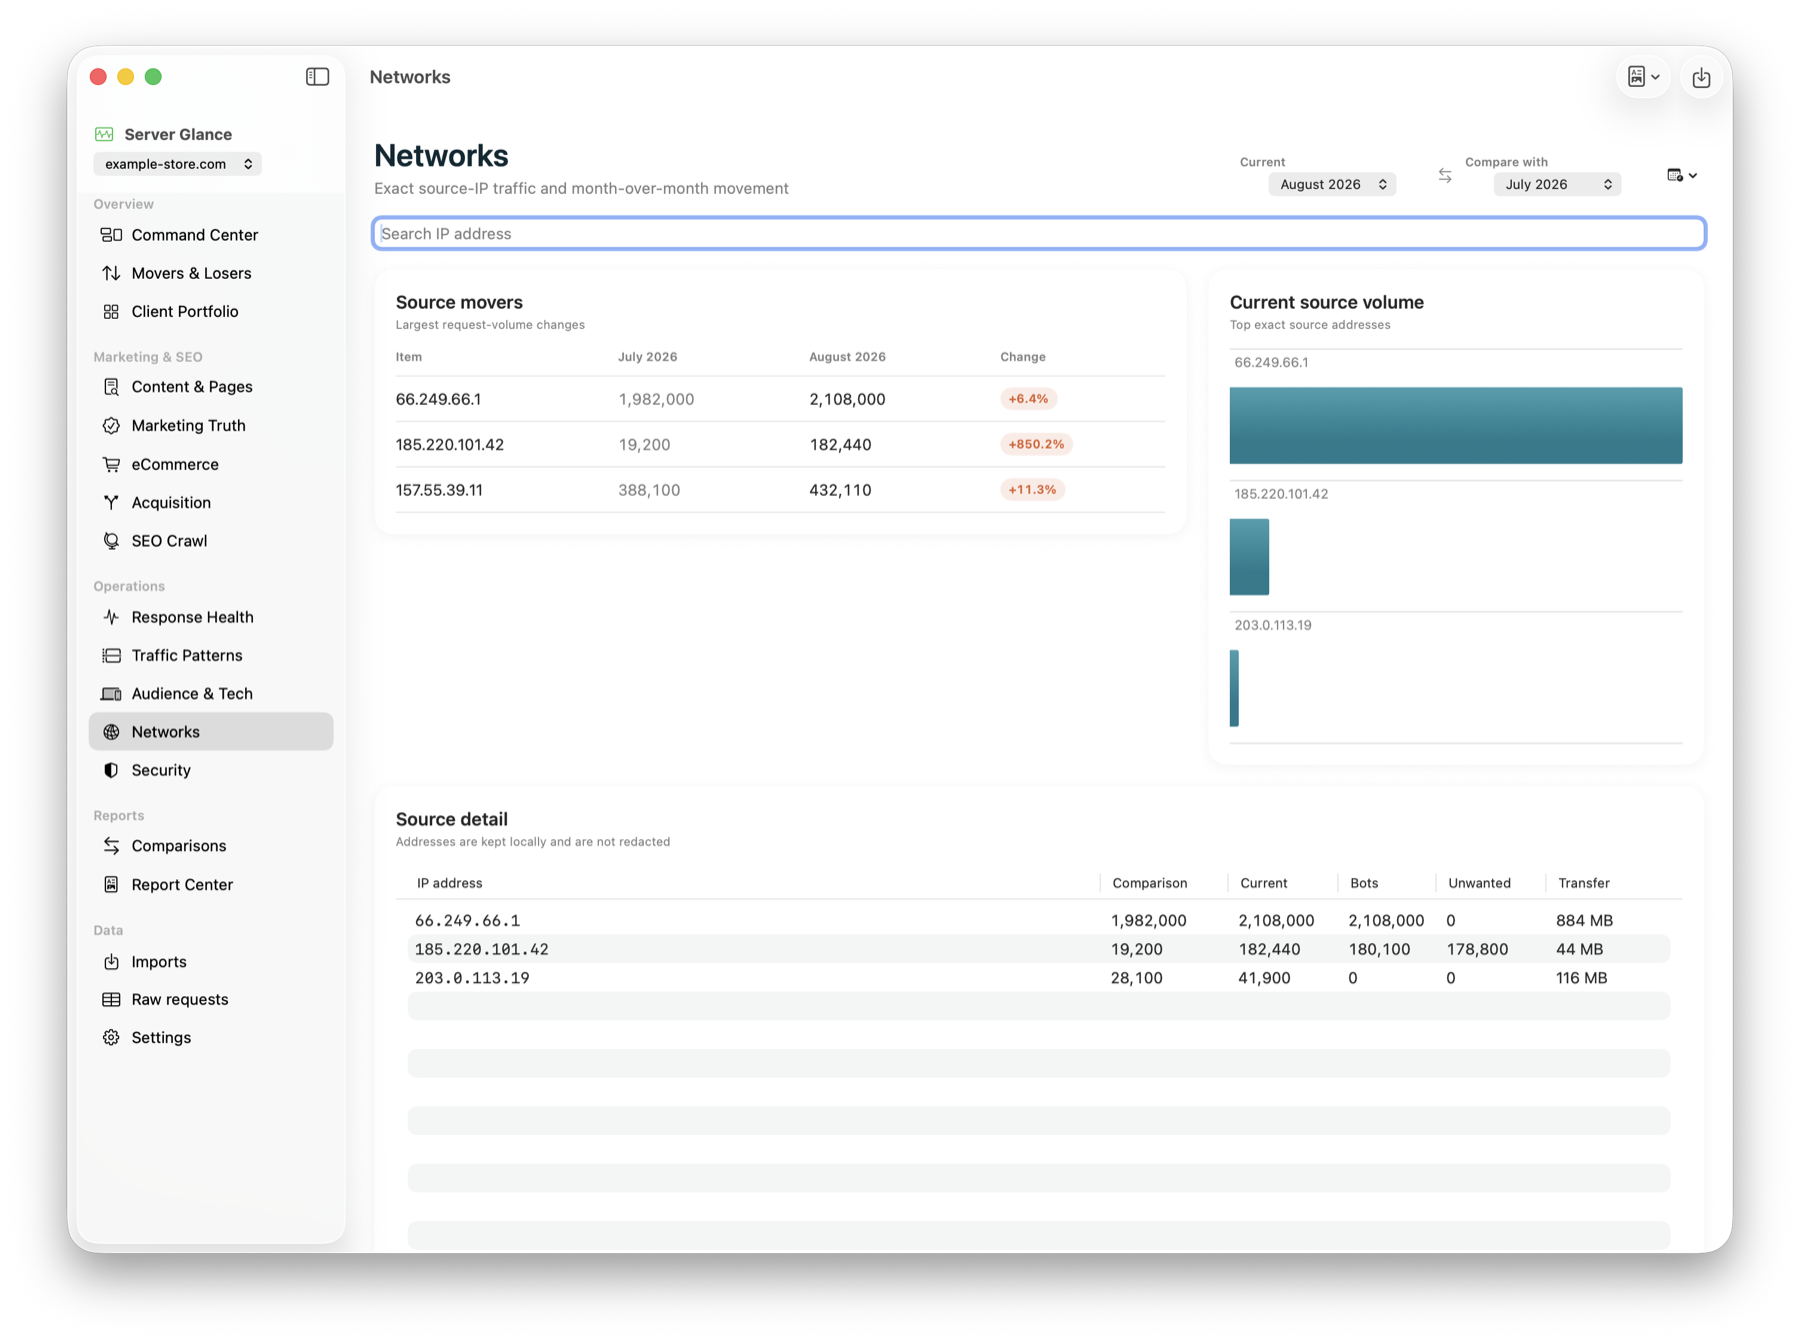
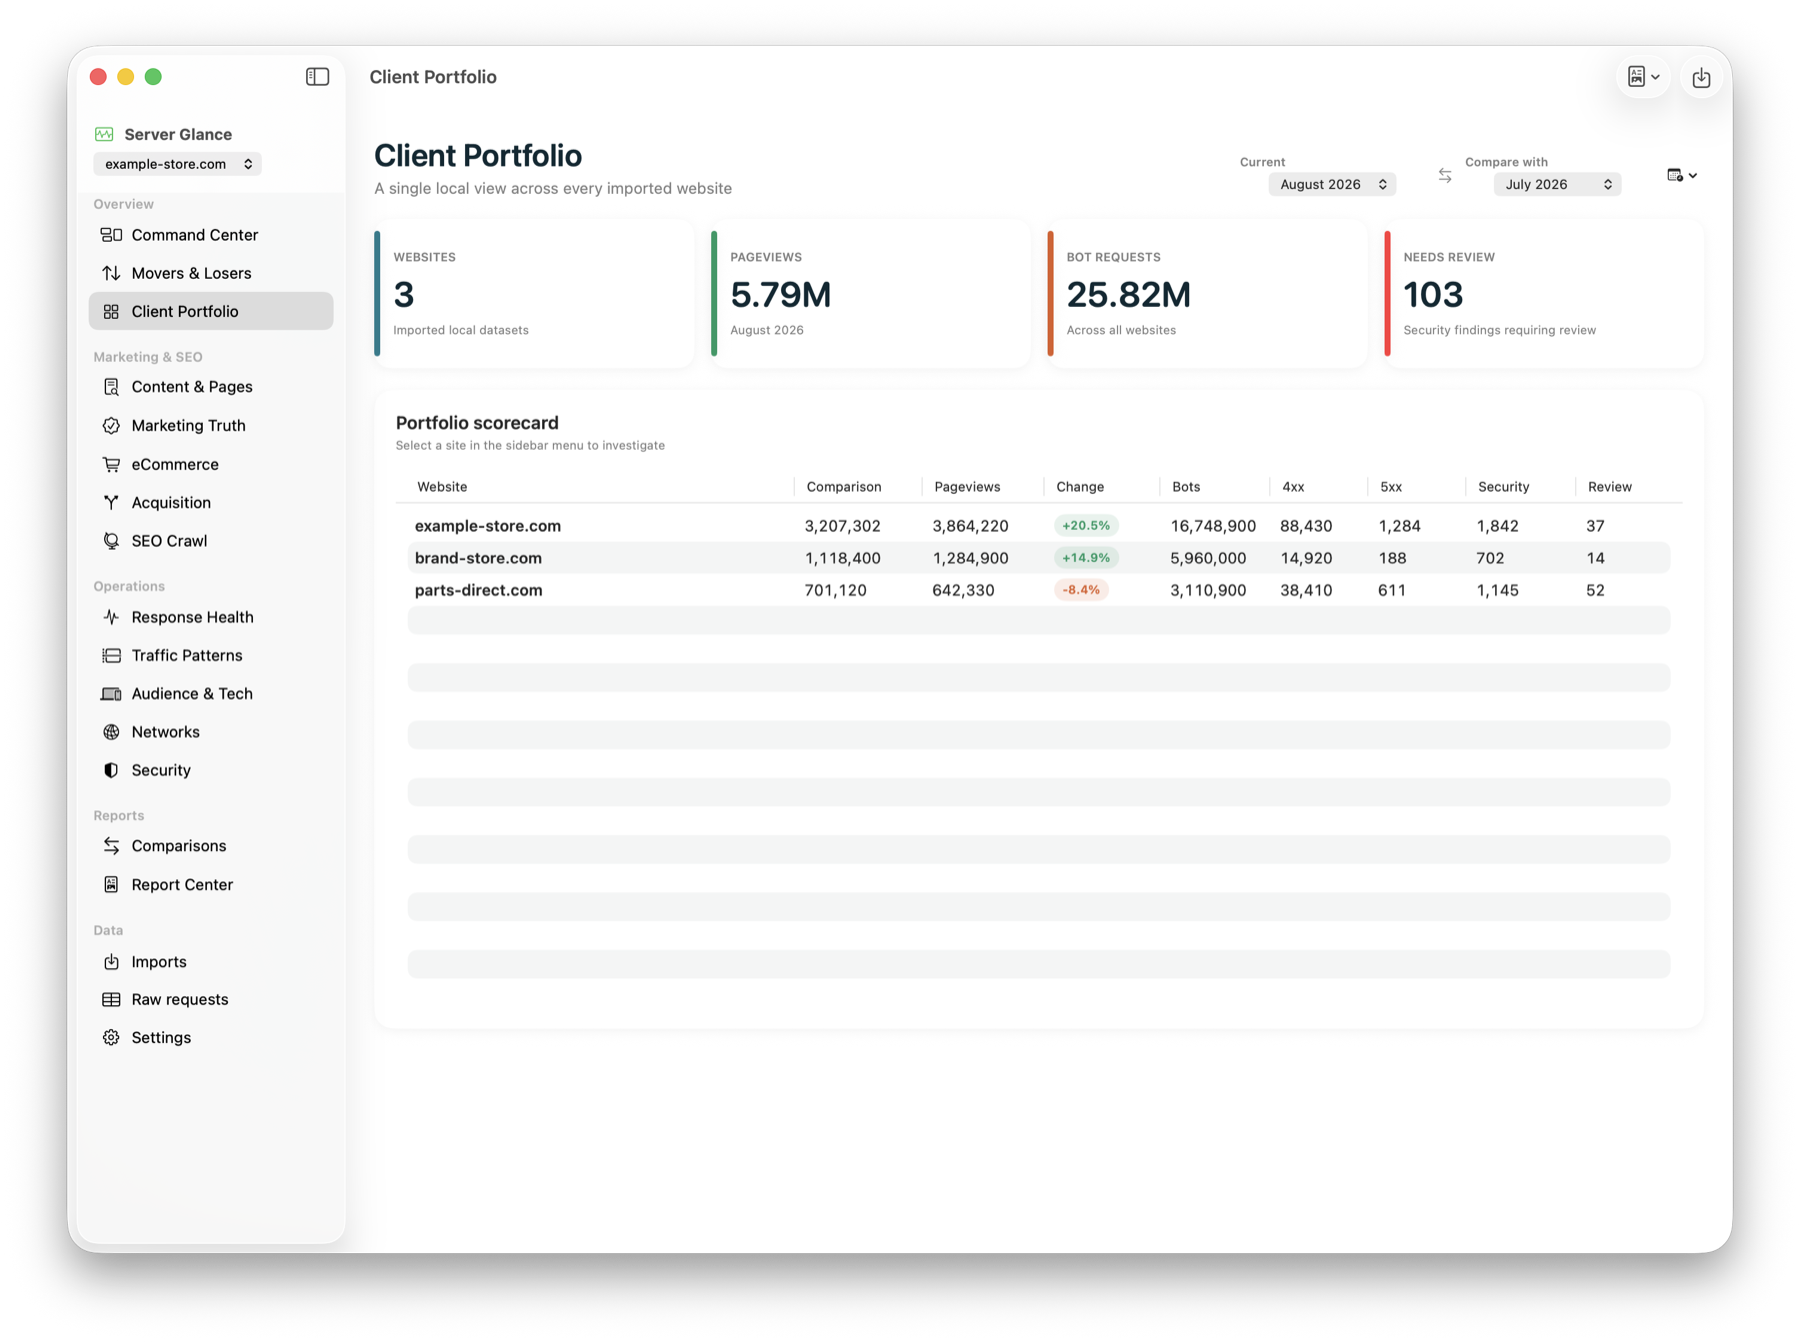
These screens are captured from Server Glance demo mode using a sample busy ecommerce site, so visitors can immediately see the kind of populated reports the app produces.
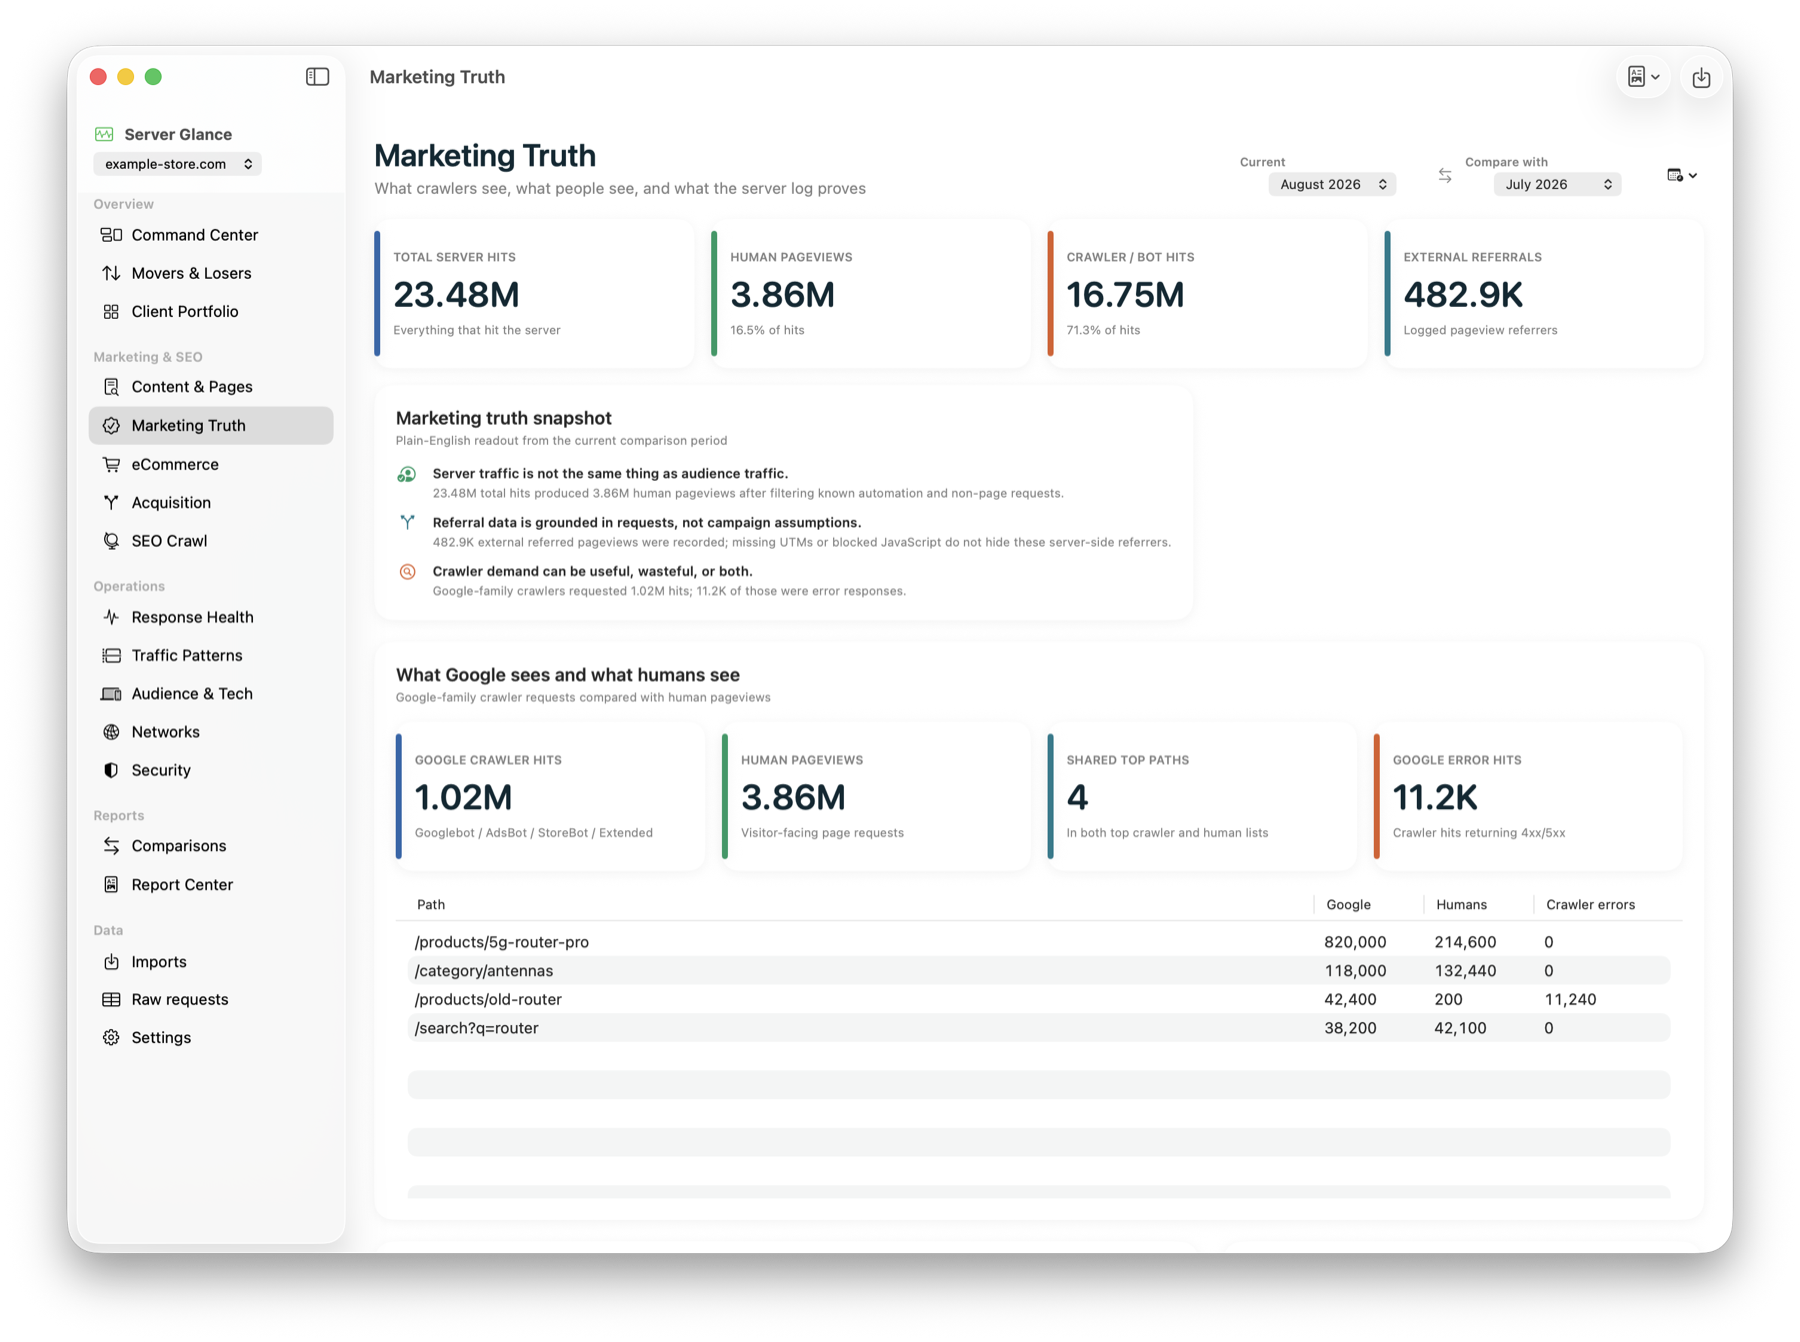
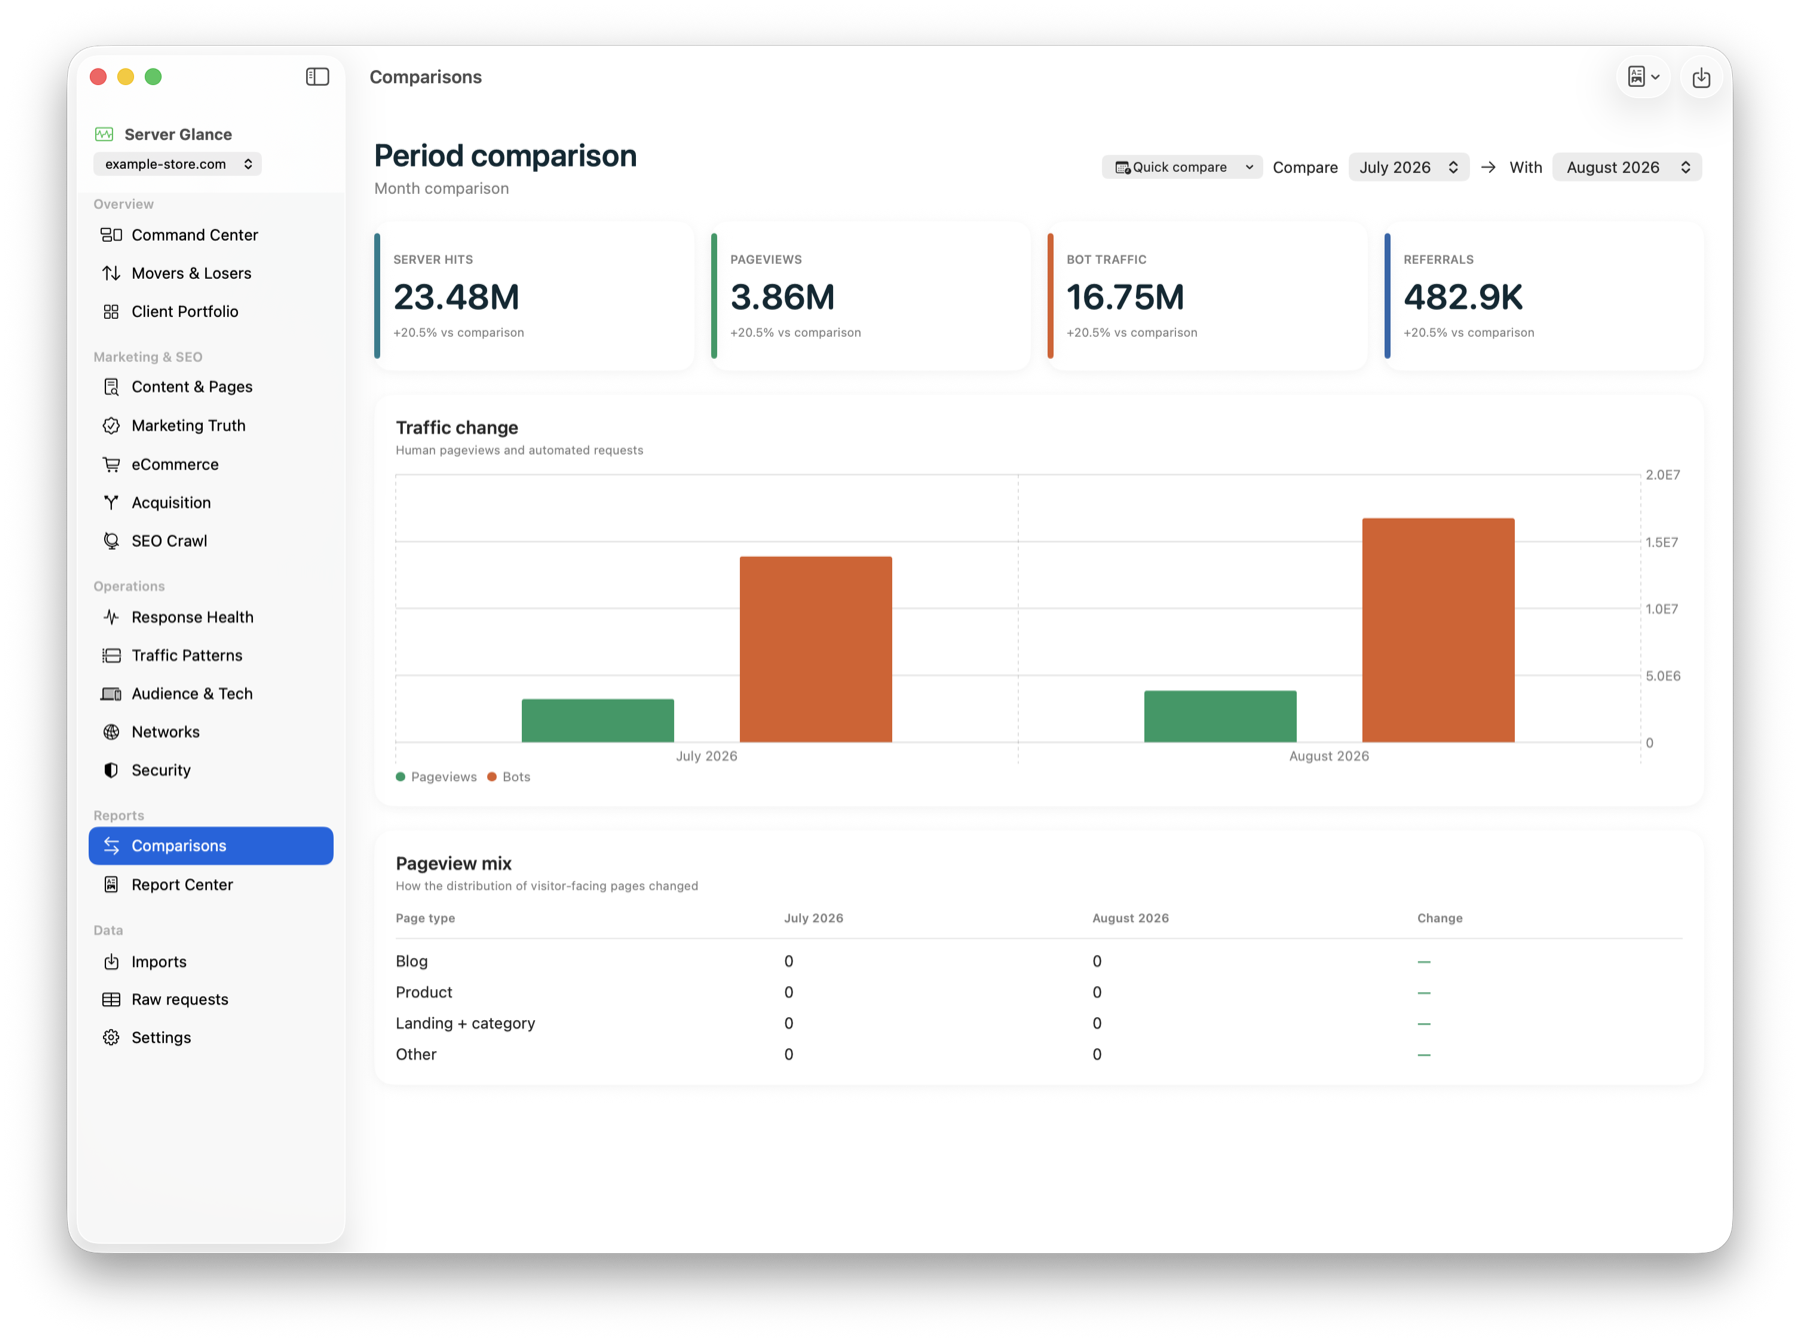
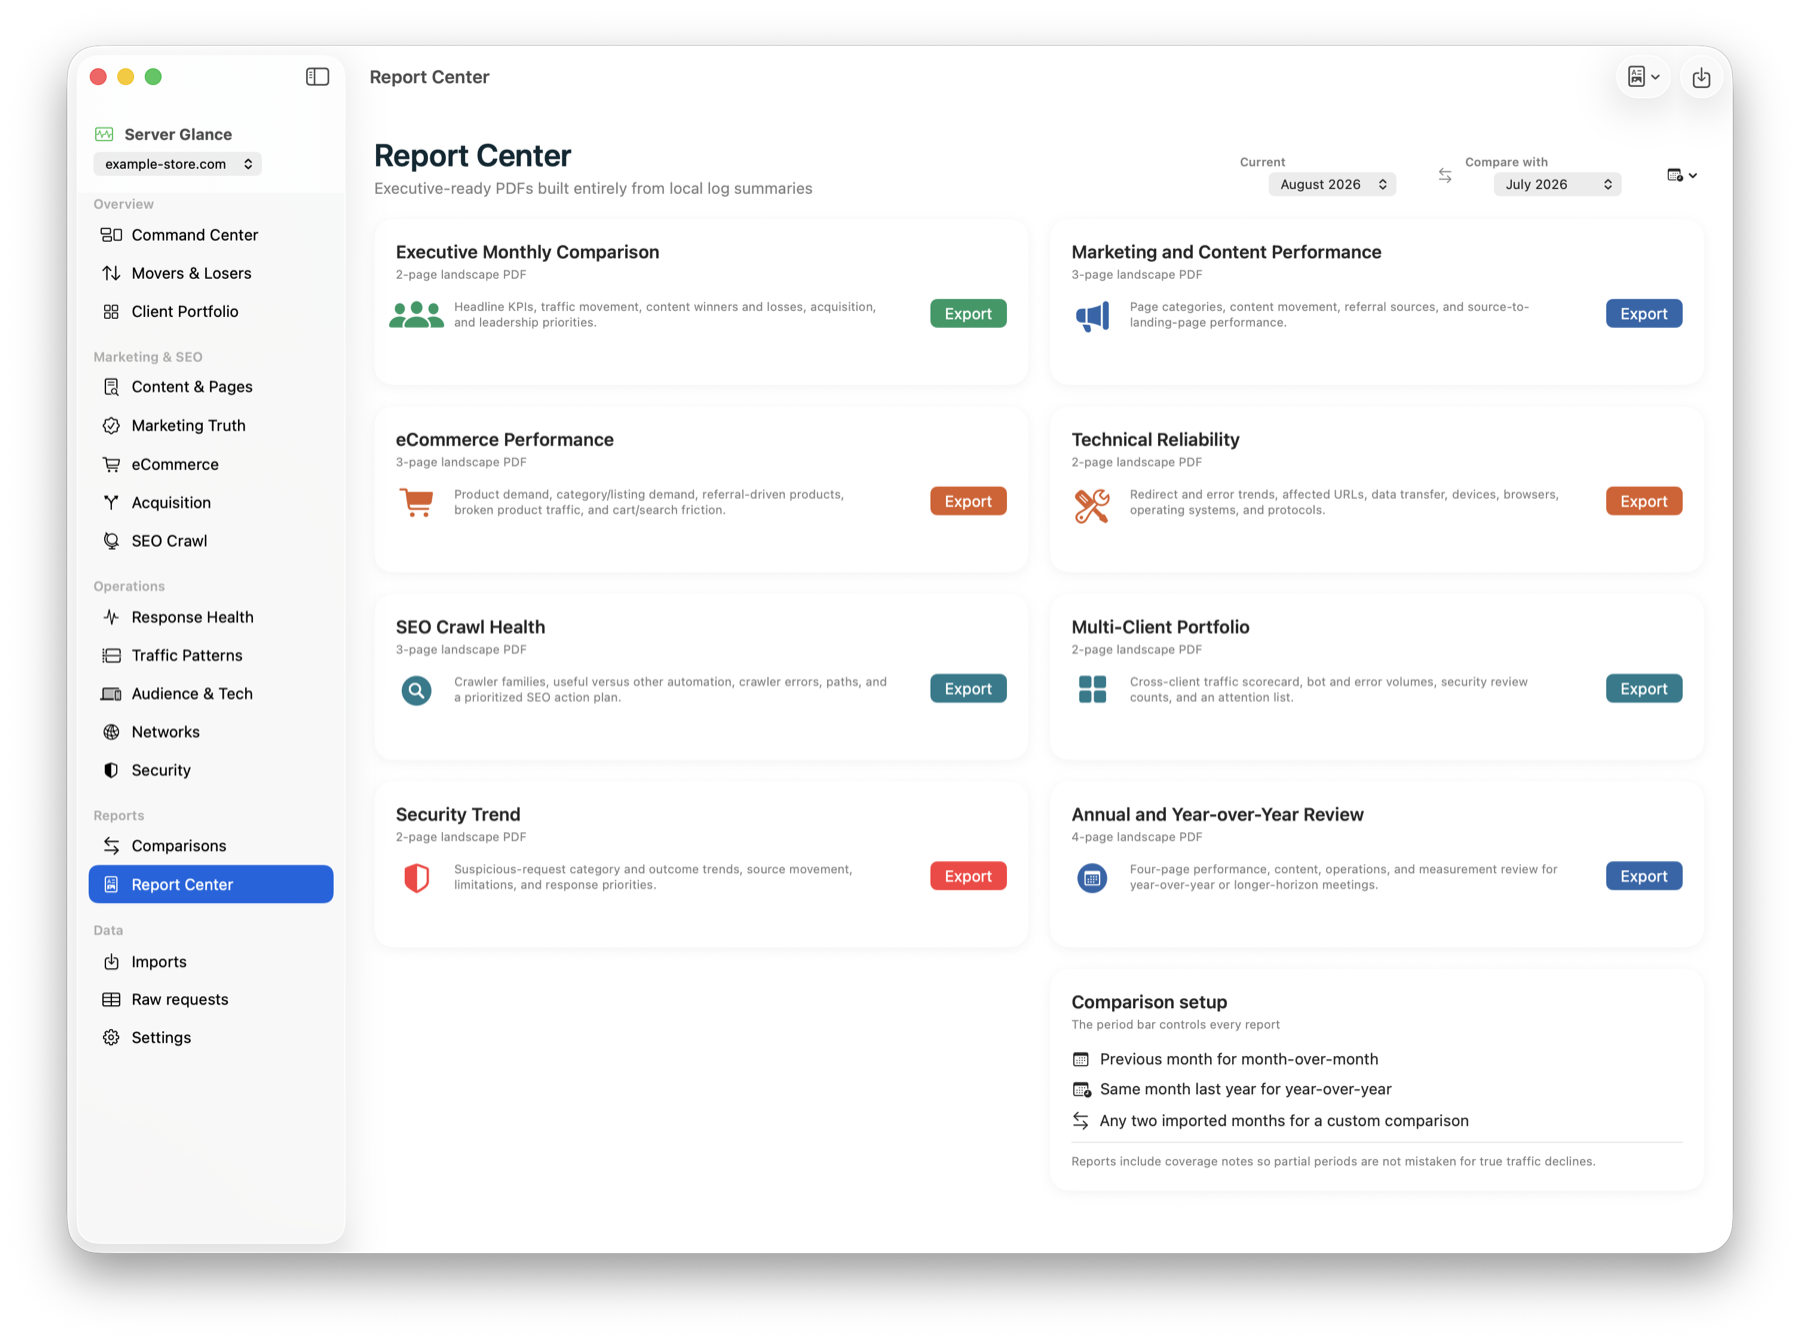
Marketing truth snapshot
Server Glance gives teams a grounded, server-side view of traffic. It helps answer the questions browser analytics often cannot: which requests were real pageviews, which were bots, which referrers reached the server, which URLs wasted crawl attention, and which suspicious requests looked successful.
Busy sites can generate tens of millions of log lines a month. Server Glance keeps the import and analysis local, stores reusable summaries, and avoids uploading sensitive IPs, customer paths, referrers, and security evidence to a third-party analytics cloud.
Web server log analysis FAQ
Server Glance is a Mac web server log analyzer that turns access logs into clear reports for marketing, SEO, ecommerce, security, and executive review.
Server Glance is designed for popular website log formats including Apache, Nginx, IIS, CloudFront, Cloudflare, AWS, and other web traffic logs.
It answers a different question. Browser analytics shows tracked visits; server logs show what actually requested your site, including bots, errors, blocked scripts, referrals, and suspicious traffic.
Yes. Server Glance separates human traffic from crawlers, good bots, bad bots, scanners, and automation so teams can see what Google sees and where crawl budget is being wasted.
Coming soon
We’re shaping the first public Mac release now. The goal is simple: give site owners, ecommerce teams, and marketing leaders a clear view of what their web server already knows.